MarketScreens User Manual
Crafted by CopperClaw · www.screens.market
Contents
1 · Getting Started — Put it together · plug it in · connect to WiFi · the side screens join · open the settings page
2 · The DataScreen — How the rows move · pause · the columns · the entry and exit scores · the gear · playlist bar
3 · The Orange and Blue Screens — The screen, piece by piece · status words
4 · The Settings Page — The Orange and Blue lists · the Auto Selector · Playlist Mode · adjustable values · side screens · time · device · maintenance
5 · Care & Troubleshooting — The golden fix · WiFi · the settings page won't load · a side screen is stuck · the clock is wrong · updates · the escalating resets
6 · Ticker Reference — Symbol formats · good to know · market indicator symbols · terminology
What Is MarketScreens?
MarketScreens is a passive US-market observability tool. It's always on and always in view — no app to open, no phone to unlock, no tab to find. Glance across the room to track your positions and discover new opportunities in the US market. Connect MarketScreens to a WiFi network, then use the settings page to choose what it displays — stocks, bonds, futures, commodities, crypto, mutual funds, or foreign exchange.
MarketScreens is meant to stay plugged in and always running. It isn't something you plug in, look at, and put away — it earns its keep by being on.
Each of those is a financial instrument, and every
instrument has a ticker: the short symbol the markets
use to identify it — AAPL for Apple, BTC-USD
for Bitcoin, ^IXIC for the Nasdaq Composite,
CL=F for crude oil. MarketScreens thinks in tickers. You
tell it which ones; it shows them.
It's one unit with three screens that work together:
- The center screen — the DataScreen. A table of every ticker you're watching: current price, daily change, change over a period you choose, volume for today, price position in the range you selected, volatility, and a entry/exit score. The gear icon in its top-left corner is where you find the settings address. The DataScreen is the brain: it connects to your WiFi, fetches the market data, and feeds the other two screens.
- The Orange screen. A live chart of one ticker at a time, rotating through your Orange list.
- The Blue screen. The same, for your Blue list.
The entry score and the exit score translate complex price and volume metrics into a simple 0 to 100 value. Each answers one specific question:
The Entry Score answers: Is this an actionable pullback or a trend breakdown?
It measures whether a drop is a healthy pullback within an intact broader uptrend, or a structural decline. A high score signals that selling momentum is exhausting while institutional volume remains supportive — highlighting an attractive entry window.
The Exit Score answers: Is this rally becoming overextended?
This is the mirror metric. It evaluates whether a stock has climbed too far above its moving averages with fading momentum, signaling that an advance may be running out of steam.
Both are mathematical snapshots of price and volume — not forecasts, and not financial advice. Chapter 2 details the exact formula and indicators behind them.
Nothing on MarketScreens is interactive except one tap on the DataScreen to pause the rotation. Everything else — what shows, where, and for how long — is set from your phone or computer on the settings page.
1. Getting Started
Put it together
Two legs screw onto the back of the unit, and the DataScreen gets the antenna:
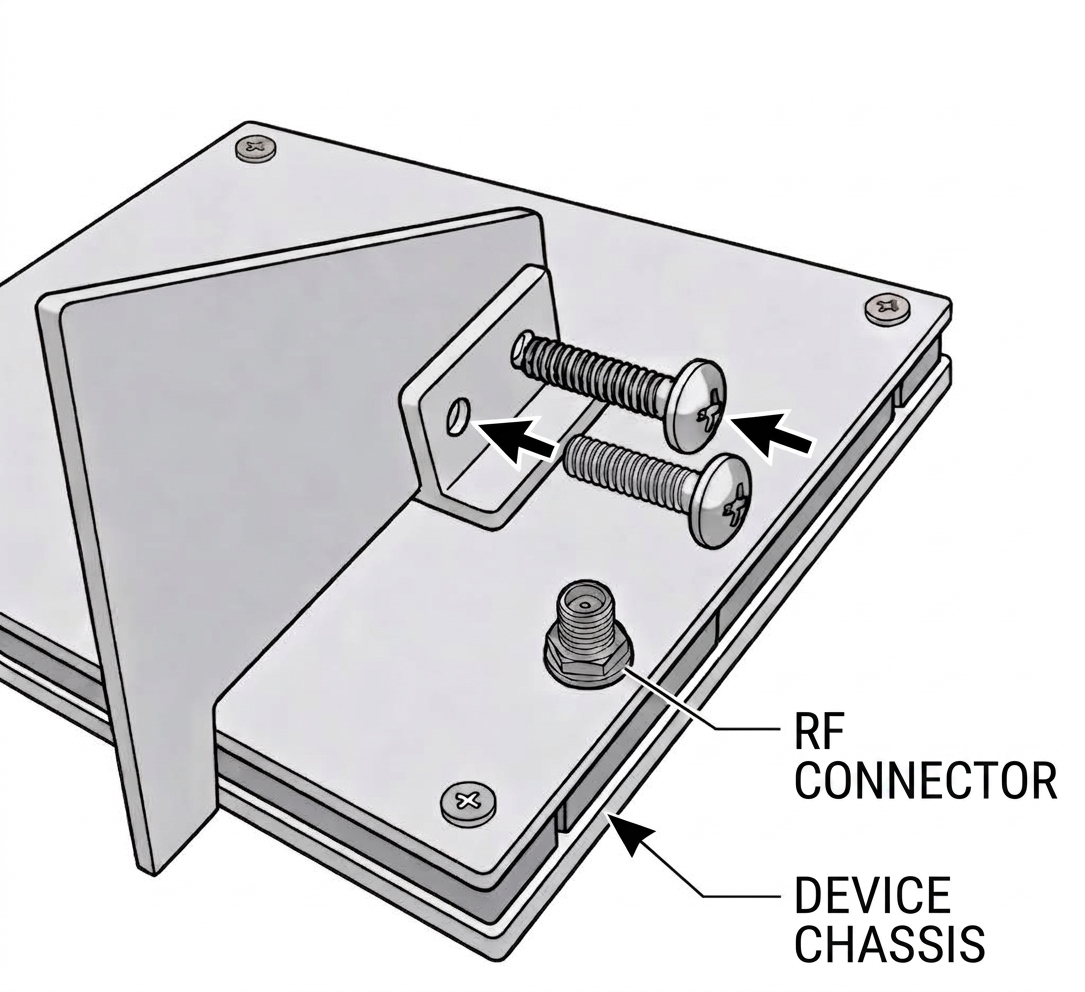
Optional: stick the included rubber feet onto the bottoms of the legs to keep them from scratching your desk.
Plug it in
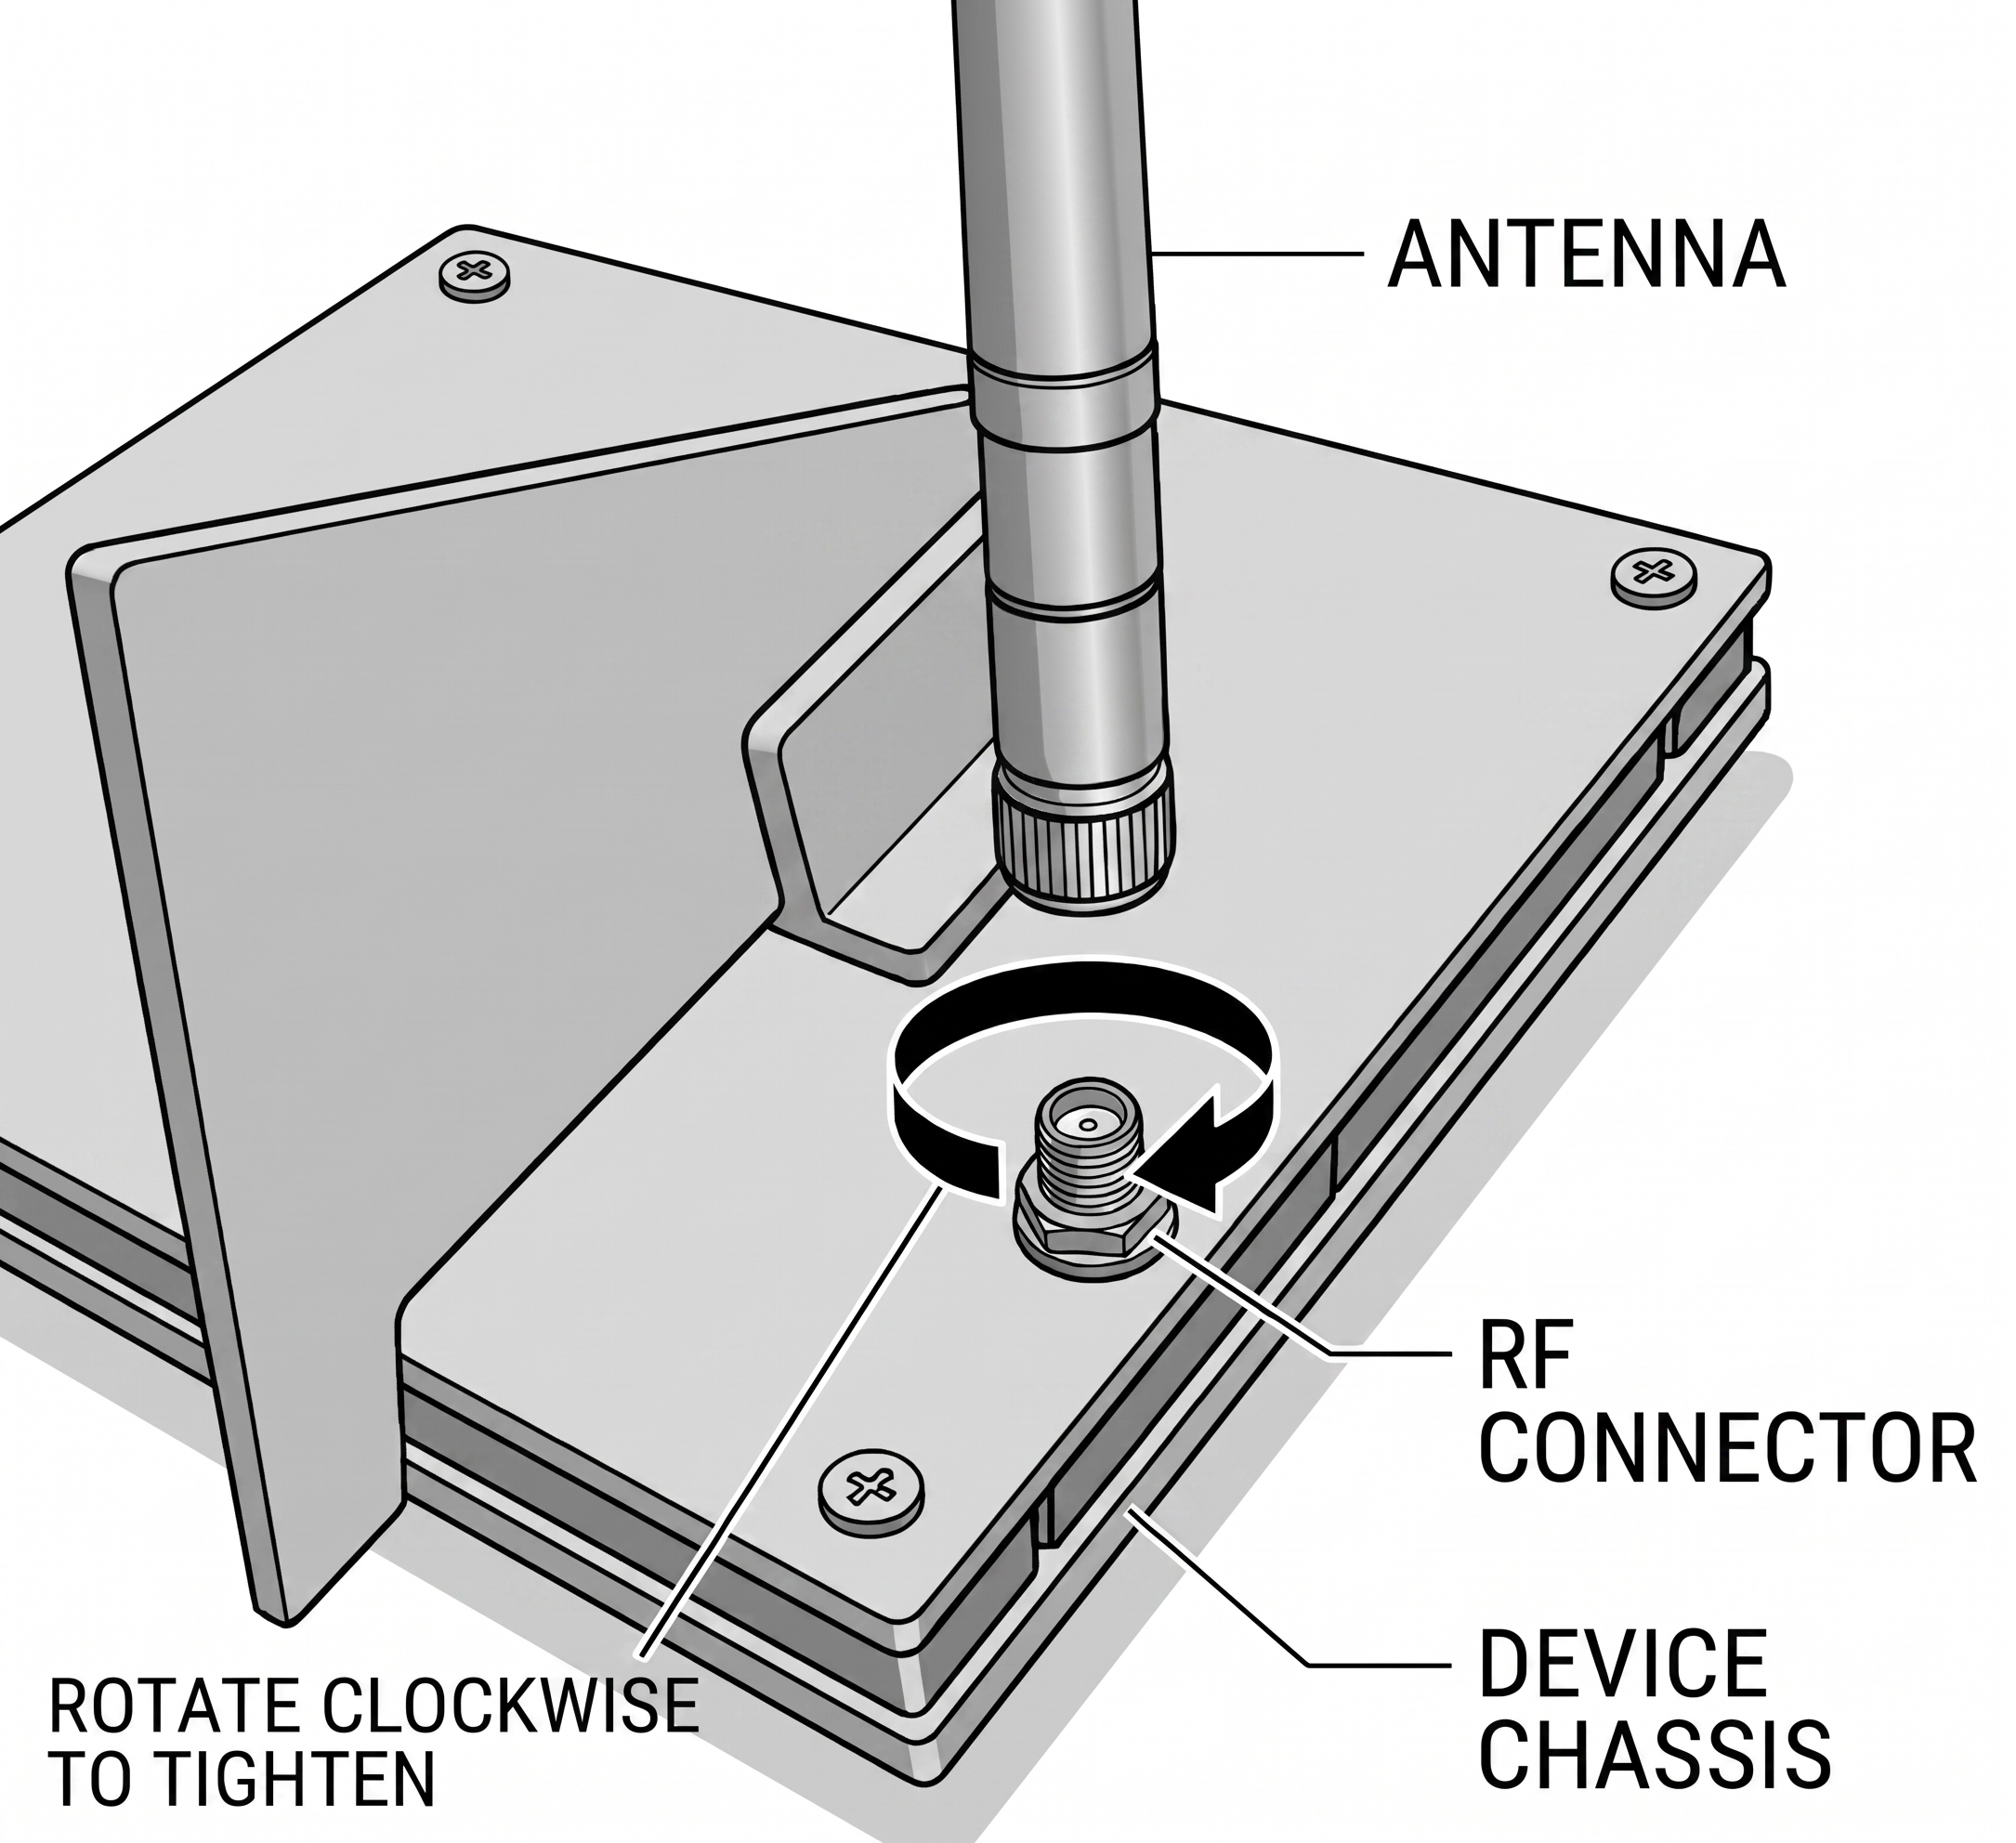
Twist the black antenna onto the RF connector on the back — once snug, it bends at its joint and rotates freely; point it upward. Connect the power cable. The screens turn on, and a small blue light next to the USB-C port confirms power.
Use the power brick that comes with MarketScreens (or any "fast charging" brick) with the included USB-C-to-USB-C cable. A standard phone brick can't feed three screens — with one, the screens may not all turn on, or may restart at random. The brick's extra USB-A port is just there if you want to charge something else.
Connect the DataScreen to WiFi
The center screen shows Scanning for WiFi networks… and then a list of nearby networks.
- Tap your network.
- Type the password on the on-screen keyboard and press the checkmark.
- Connecting to WiFi… → WiFi Connected! — if the password was wrong, it says Connection failed. Try again. and returns you to the keyboard.
- Loading market data… — the default tickers are about to be displayed.
Now the table appears. Rows light up one at a time as their data arrives; a grey row is one that simply hasn't loaded live data yet.
The WiFi details are now saved. Every future power-up goes from Auto Connecting to WiFi… → Loading market data… on its own.
The side screens join by themselves
The side screens show the CopperClaw lobster until the DataScreen has data for them, then go straight to their first chart. One side screen is Orange and the other is Blue — the colored dot and clock in each screen's corner say which is which. There is nothing to press.
If a side screen never gets past the lobster, make sure the antenna is tightened all the way.
Open the settings page
Tap the gear icon
 on the
DataScreen. It shows a QR code and two addresses:
on the
DataScreen. It shows a QR code and two addresses:
http://192.168.x.x— the numeric address. Scan the QR code or type it; it opens instantly.http://marketscreens-xxxx.local— the same page by name, easier to remember, though it can take a few seconds to find the DataScreen the first time.
Bookmark it. The settings page is where you decide what MarketScreens shows.
Where things live
| You want to… | Go to… |
|---|---|
| Change tickers, lists, or how the screens behave | The settings page |
| See the settings address again | Tap the gear icon on the DataScreen |
| Pause the rotating tickers | Tap the DataScreen (Chapter 2) |
| Move MarketScreens to a new WiFi network | Settings → Maintenance → Clear WiFi & Reboot (Chapter 5) |
2. The DataScreen
The DataScreen is the screen in the middle. It has two panes: the Orange list on top and the Blue list below — a thin line in the screen's color sits on top of each pane as a separator. Every ticker you're watching has a row.
How the rows move
Each list rotates through its tickers, one at a time, for the display time you set (default 10 seconds). The ticker currently on a side screen sits in the top row of its pane, and the line above it flashes brighter at the moment it changes. When a ticker's turn ends, the next one moves to the top and the one you were just looking at slides underneath — so the rows below the top are always the tickers you saw most recently, newest first.
Pause
Tap any row to pause both side screens on their current tickers. A pause symbol (⏸) appears in the middle of the table, with previous (⏮) and next (⏭) buttons that move both lists one ticker back or forward. Tap the circle in the middle to resume.
The columns
| Column | What it shows |
|---|---|
| Ticker | The symbol representing the financial instrument. |
| PRICE | The current regular-market-hours price; outside market hours, the last regular-session close. Pre- and post-market moves show on the side screens, not here. |
| 24h Δ | Percent change from the previous market close. |
| 𝑁d Δ | Percent distance from the ticker's 𝑁-day moving average, where 𝑁 is the moving-average timeframe you chose in settings — the header reads 10d Δ, 50d Δ, and so on. Above the average is green, below is red. |
| VOL | Volume traded so far today. |
| 𝑁w POS | Where the price sits inside its high–low range over the weekly lookback period you chose, from 0 (at the low) to 100 (at the high). 4w POS means a four-week window. |
| HV𝑁 | Historical Volatility: how much the price has been moving over the last 𝑁 trading days, scaled to a yearly figure so that a 10-day and a 30-day reading can be compared directly. Higher means more volatility. |
| ENTRY / EXIT | Entry on the left and exit on the right, each 0–100. Explained below. |
A dash means the value isn't available for that ticker — some instruments have no volume, some are too new for a 200-day average.
The entry and exit scores
Both scores are built from five standard technical indicators. Each indicator contributes a share of the 100 points, scored proportionally rather than all-or-nothing, so the numbers move smoothly through the day. If an indicator doesn't exist for a ticker — no volume data, not enough history — its share is redistributed, so any ticker can still reach 100.
The entry score asks: how oversold is this ticker, and is the dip happening inside a healthy trend?
The exit score asks: how overbought is this ticker, and is the run starting to tire?
Both use the same five instruments, read from opposite ends:
- RSI — deep oversold favors entry; overbought favors exit.
- Distance from the 50-day moving average — a deep pullback favors entry; a stretched climb favors exit.
- MACD momentum — selling pressure easing favors entry; buying pressure fading favors exit.
- The 200-day moving average — price holding above it (trend intact) favors entry; price far above it favors exit.
- Chaikin Money Flow — volume arriving on up days favors entry; volume leaving on down days favors exit.
Each score also earns a small bonus when the price sits outside its Bollinger Bands — below the lower band for entry, above the upper for exit.
The two scores are independent. A ticker chopping sideways can score low on both, and neither is the inverse of the other.
The gear
The gear icon in the top-left corner opens the address page: a QR code and the two addresses for the settings page (Chapter 4). While the DataScreen is loading data, a thin arc around the gear fills up as the rows come in.
Playlist bar
When Playlist Mode is running (Chapter 4), a thin bar along the bottom edge shows which step of the playlist is on the screens.
3. The Orange and Blue Screens
The two side screens each show one ticker at a time, as a live chart. Each screen has its own list — the Orange list and the Blue list — and steps through it at the pace you set on the settings page (Ticker Graph Display Time, 5 to 120 seconds). The two lists are independent — each holds its own tickers.
Everything on a side screen is a raw instrument reading. The computed values live on the DataScreen.
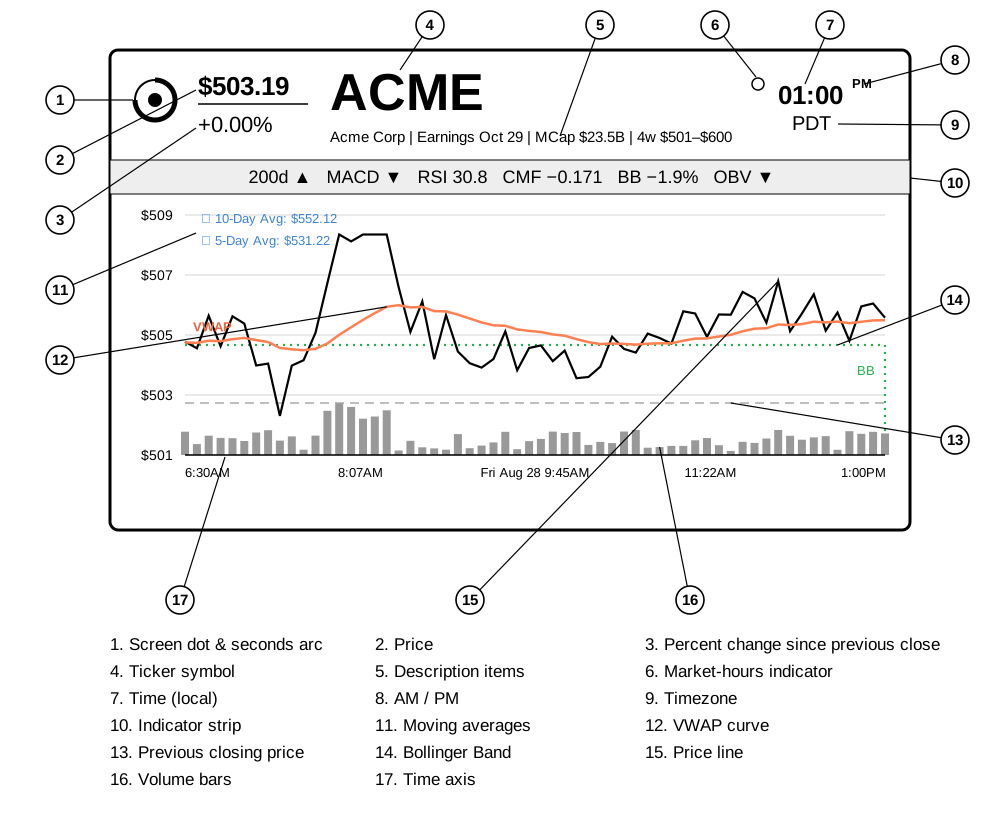
The screen, piece by piece
Screen dot & seconds arc — the colored dot names the screen: orange or blue. With Show Seconds Indicator on, an arc around the dot fills as the display time runs down, so you can see when the next ticker is coming. While the screen is searching for the DataScreen, a spinner takes the arc's place; the two never show together.
Price — yellow during regular trading hours. In pre-market it turns pink and in post-market purple, and the number is the live extended-hours price. Overnight and on weekends it turns white and holds the last close.
Percent change — change since the previous close: green up, red down. During pre- and post-market this is the extended-hours change, tinted to match the price.
Ticker symbol — the financial instrument on screen right now.
Description items — a line that scrolls if it runs long, holding whichever items you switched on under Side-Screen Description Items on the settings page: company name, next earnings date, market cap, EPS, P/E, and the high–low range over your weekly lookback period. When earnings are less than five days away, the earnings date changes color to stand out.
Market-hours indicator — ● green for open, ◐ pink for pre-market, ◑ purple for post-market, ○ grey for closed, ✕ red for market holidays and early-close afternoons. It follows the official NYSE calendar, so holidays need no setup, and it always reflects the US stock market — even while a crypto or forex ticker is on screen.
Time — the current local time, colored orange or blue to match the screen. Shows in 12- or 24-hour format — a settings-page choice.
AM / PM — hidden when Use 24-Hour Time is on.
Timezone — the timezone auto-detected from your WiFi network's location. If your network runs through a VPN, the detected timezone will follow the VPN's location — time can be set manually on the settings page.
Indicator strip — six daily-bar readings for the ticker on screen:
Label Reading 200d ▲ price is above its 200-day moving average, ▼ below MACD ▲ momentum histogram rising, ▼ falling RSI Relative strength index, 0–100. Green toward 35 and below, red toward 70 and above CMF Chaikin Money Flow, −1 to +1. Green above +0.05, red below −0.05 BB Bollinger %B: where the price sits between the bands, 0% at the lower band and 100% at the upper. Beyond the bands the number goes neon — green below 0%, red above 100% OBV ▲ on-balance volume is above its average, ▼ below A dash means the reading isn't available for that ticker.
Moving averages — with Graph Moving Average on, a horizontal line at the moving average, using the timeframe you chose for the DataScreen's 𝑁d Δ column; a second line comes from the Second Moving Average setting. When an average sits outside the chart's price range, a small labeled arrow at the edge points toward it — as both do here. The averages are drawn as level lines — each is a fixed reference for the day, not a third moving chart line.
VWAP curve — with Graph Volume-Weighted Average Price on, the coral-colored curve shows the average price paid so far in the session, weighted by how much traded at each level.
Previous closing price — a grey dashed line at the previous session's close: the baseline the percent change is measured against. A glance shows which side of it the price is on.
Bollinger Band — with Graph Bollinger Bands on, the 20-day bands are drawn as dashed lines that run across the chart and bend upward or downward at the edge. Here only the lower band is inside the price range.
Price line — the ticker's recent trading history, with a gradient fill beneath. Green when the price is above the previous close, red when below.
Volume bars — with Graph Volume Bars on, bars along the bottom divide the chart's timeline into slices and show how much traded in each.
Time axis — session time across the bottom; the middle tick carries the date of the session the chart shows.
Status words
When a side screen has nothing to chart, the ticker symbol's spot shows a status instead:
- SCANNING — looking for the DataScreen. Normal for a few seconds at power-up.
- CONNECTED — paired, waiting for the DataScreen to finish loading its tickers. A spinner sits in the chart area until data arrives.
- NO TICKERS — this screen's list is empty (for example, Fresh Start cleared it at midnight). Add tickers to the list on the settings page and the screen wakes on its own.
- LOST — no data from the DataScreen for ten seconds. The screen rescans and reconnects on its own; RECONNECTED shows briefly when it does.
If a side screen stays on SCANNING or LOST, the Pair Orange / Pair Blue buttons on the settings page re-introduce it to the DataScreen (Chapter 5).
4. The Settings Page
Everything MarketScreens shows is decided here. The settings page is served by the DataScreen itself, so the phone or computer you use must be on the same WiFi network as MarketScreens — a device on a different network, or on cellular data, can't reach it. Tap the gear on the DataScreen and scan the QR code, or type the address it shows into your laptop or phone browser. Note: the IP address and marketscreens-XXXX.local go to the same place.
Changes to the ticker lists take effect immediately with Apply. Everything else — the adjustable values, side-screen options, time, and brightness — takes effect with Save & Reboot at the bottom of the page.
The Orange and Blue lists
The top of the page holds the two ticker lists, one per side screen. Type a symbol and + Add Ticker, remove one with its X, or Clear the whole list. Apply sends the new list to the screens right away — no reboot. Swap Screens trades the two lists in one tap.
A ticker can appear only once per screen.
Each list has a row of tools:
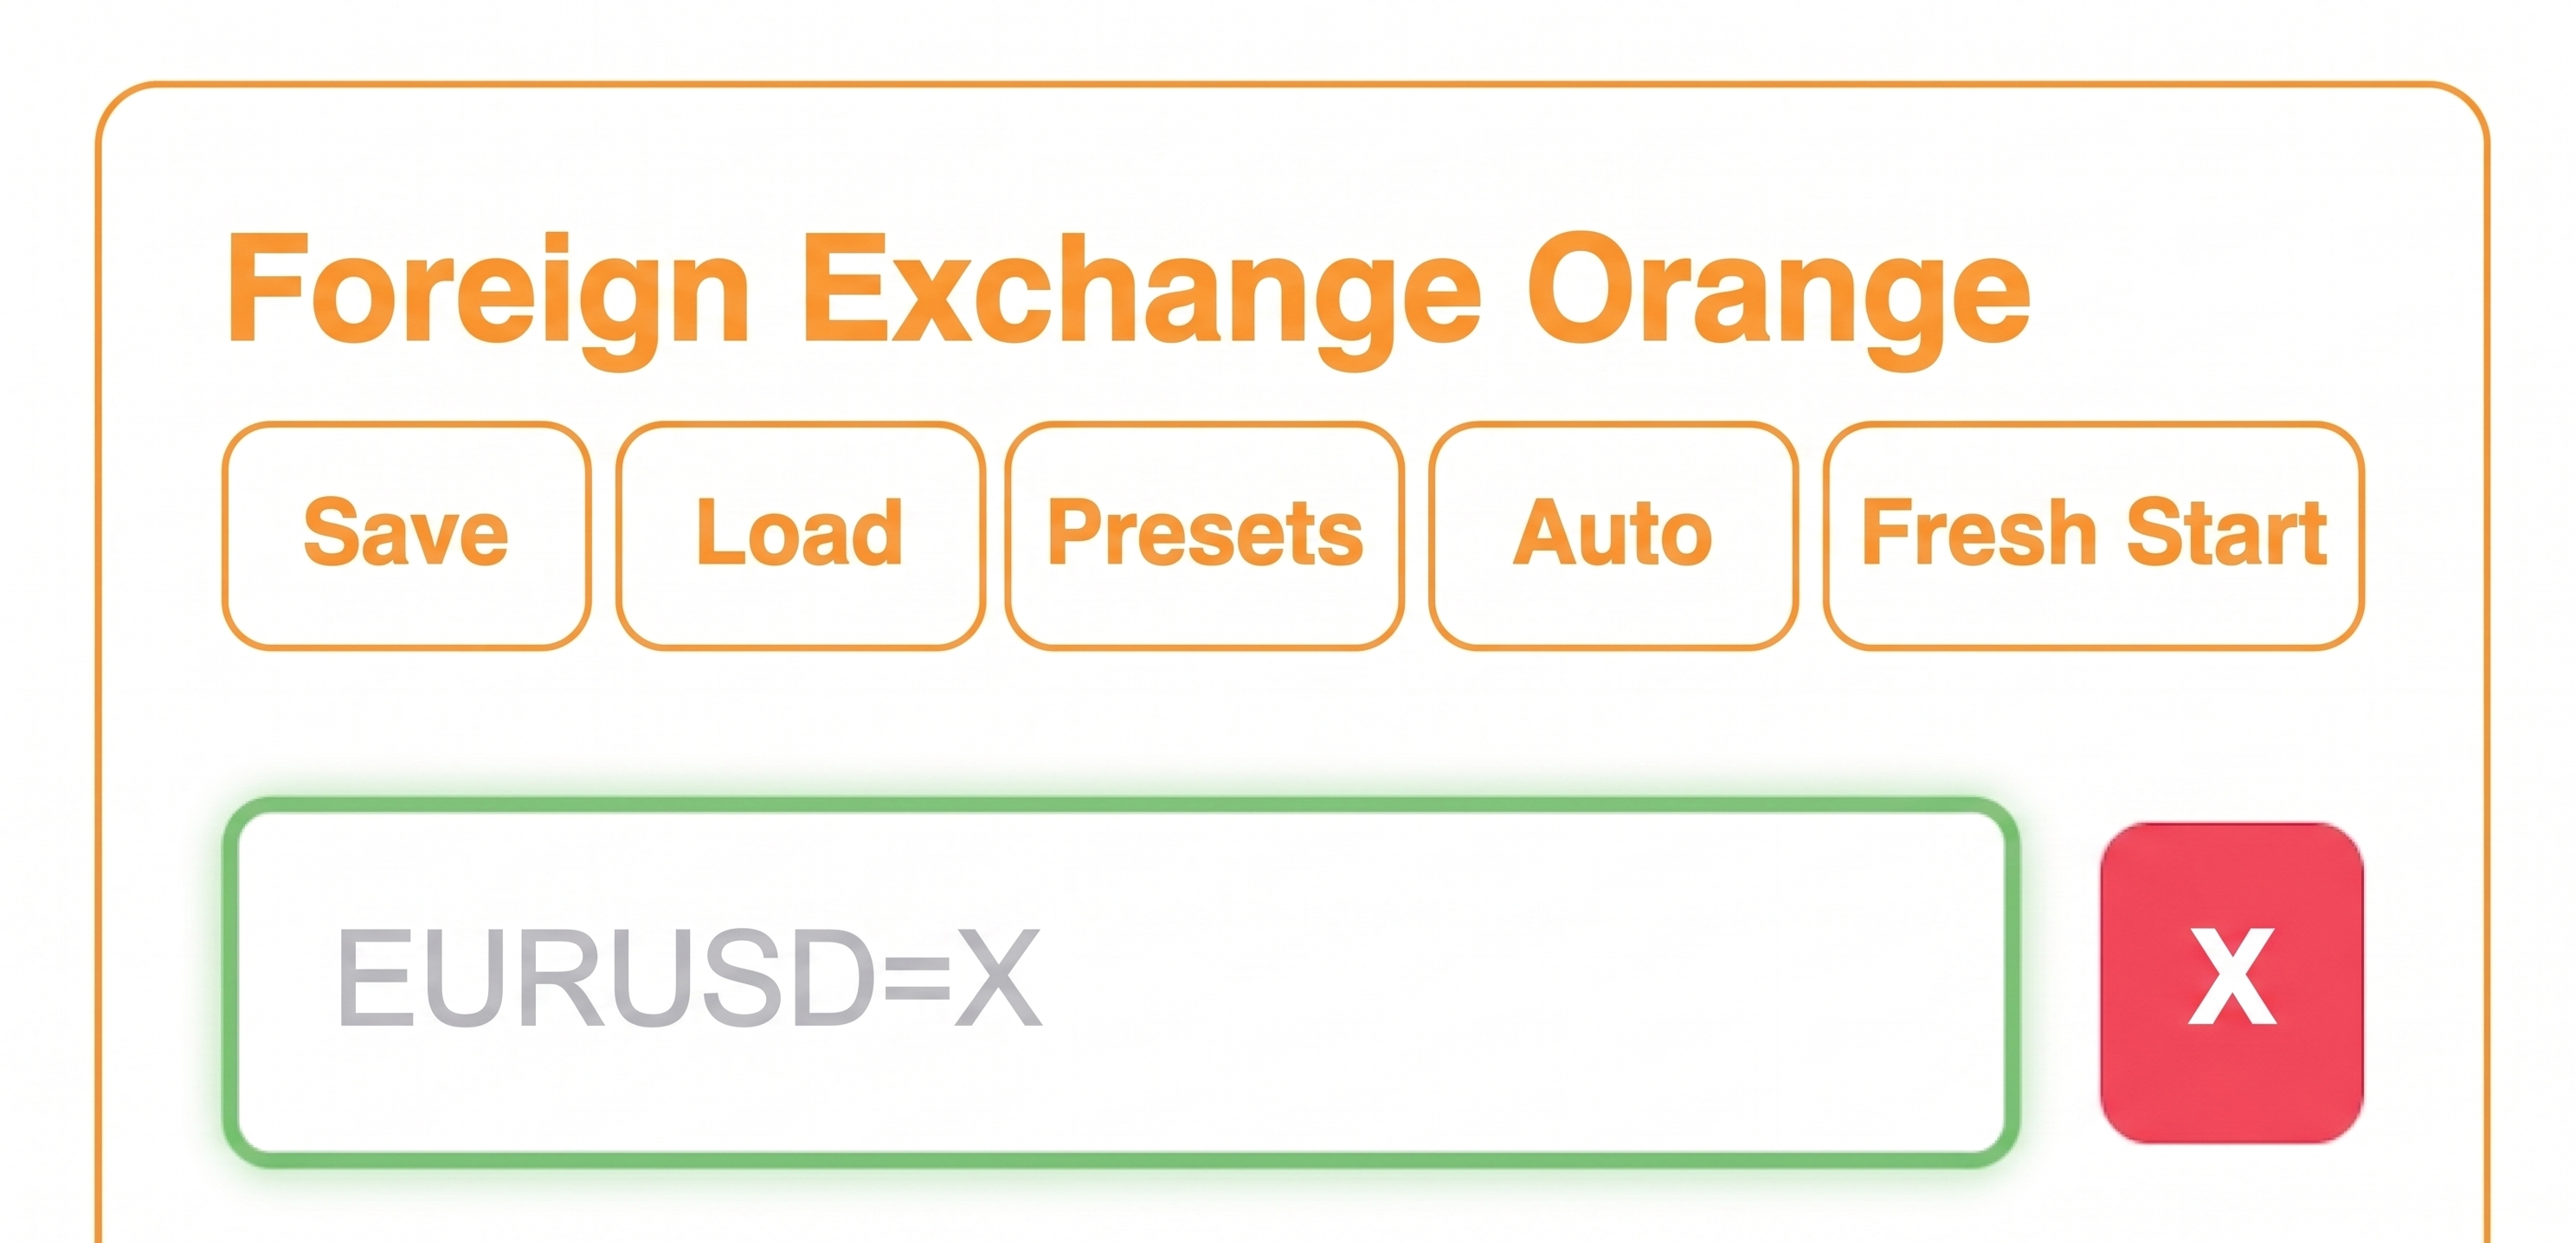
As you type a ticker, MarketScreens checks the symbol live — a green glow means it's recognized, a red glow means it isn't.
- Save — store the current list under a name (up to 48 characters). Saved lists appear under Your lists; the device keeps up to 40 of them, shared across both screens. Ticking When full, replace least-used list makes room by dropping the list you've touched least recently. Starred lists are never the ones dropped. Up to 20 lists can be starred at a time.
- Load — bring back a saved list. This panel is also where you delete a list (X) and where you star a list: ★ marks a list do not auto-replace — a starred list will not be dropped to make room, though you can still delete it yourself.
- Presets — pre-made lists for various types of tickers and industries. Each preset has an orange and a blue version.
- Auto — the Auto Selector, explained in the next section.
- Fresh Start — clears this screen's list every night at midnight: a clean slate for each trading day, so yesterday's watchlist never lingers — each morning you pick only what deserves attention today. Only the screen is cleared — your saved lists and the presets themselves are untouched.
The Auto Selector
Every night the server scans the entire NASDAQ and NYSE and assigns entry and exit scores to each company. The Auto Selector turns that scan into a ticker list: set your filters, choose how many tickers you want, and Load picks — the highest entry scores win.
The filters:
- Volatility (HV) range — how much daily movement you want. More volatility means more risk: quicker gains, and just as quickly, losses.
- Entry score range — how oversold, per Chapter 2's entry score.
- Market cap range — company size in billions of dollars, from $0 (no floor) up to $10,000 billion — higher than any listed company, so effectively no ceiling.
- Sector and industry — narrow the scan to one corner of the market. A sector is the broad slice (Energy, Technology, Healthcare); an industry is the finer cut inside it (Oil & Gas, Semiconductors, Biotechnology).
Loading replaces the screen's current tickers, and auto-selections don't duplicate what the other screen is showing. With Auto-Refresh on, the list follows the market on its own. The overnight scan does the heavy lifting — scoring every company on the NASDAQ and NYSE; each morning at 10 AM Eastern, once the opening bell has settled, the top candidates are re-scored against live prices, your filters are re-run, and the screen swaps in the new tickers with the highest entry scores. Loading or applying a list by hand turns Auto-Refresh off for that screen — a hand-picked list is never overwritten.
Playlist Mode
Playlist Mode rotates the screens through a sequence of lists. Each step pairs an orange list with a blue list; both screens switch together, staying on each step for the number of rotations you choose. Build steps with + Add Step, pick a list for each side, and Apply Playlist — it starts immediately, and a thin bar along the bottom of the DataScreen shows which step is on the screens (Chapter 2). Deactivate it and the screens return to their standard Orange and Blue lists.
Adjustable Values
The numbers behind the columns and charts:
- Moving Average Timeframe — 5 to 200 days. Drives the DataScreen's 𝑁d Δ column and the moving-average line on the side screens.
- Second Moving Average — an extra average drawn on the charts only.
- High/Low Weekly Lookback Period — the window behind the 𝑁w POS column and the high–low range in the side-screen description.
- Volatility Window (HV) — how many trading days feed the HV𝑁 column.
- Ticker Graph Display Time — how long each ticker holds a side screen, 5 to 120 seconds.
Side Screens
- Show Pre/Post Market Price+Percent — during pre- and post-market sessions, the side screens show the live extended-hours price and percent change, colored pink for pre-market and purple for post-market (Chapter 3). The DataScreen always shows the regular-market-hours price.
- Show Seconds Indicator — the arc around the corner dot that represents how long the current ticker has been displayed.
- Graph Add-ons — the four chart overlays: VWAP, moving average, volume bars, Bollinger Bands.
- Side-Screen Description Items — which facts ride the description line: company name, earnings date, market cap, EPS, P/E, and the high/low range. Switch on as few or as many as you like.
Time
- Use 24-Hour Time — switches every clock on MarketScreens to 24-hour format.
- Override auto-detected time — set the time by hand. Useful when the auto-detected timezone is wrong — for example, when your network runs through a VPN.
Device
Screen Brightness (5–255) for the DataScreen, and the Save & Reboot button that applies this section and everything above it that isn't a list edit.
Maintenance
- Updates Page — check for and install firmware updates on all three screens, individually or all at once (Update All to Newest).
- Pair Orange / Pair Blue — re-introduce a side screen that's stuck searching (Chapter 5).
- Send State to Proxy — uploads a diagnostic snapshot of the device's current state to the server. Useful when reporting a problem; harmless otherwise.
- Clear Ticker Cache & Reboot — wipes the stored ticker data and reboots. The next boot fetches everything from scratch, so it takes longer than usual.
- Reset Screen Connections — forgets which side screen is Orange and which is Blue, then reboots. The side screens re-pair on their own: the first to connect becomes Orange, the second Blue (Chapter 5 covers when to reach for this).
- Clear WiFi & Reboot — forgets the WiFi network and reboots into first-time WiFi setup (Chapter 1).
- Clear All Preferences & Reboot — the factory reset: every setting, list, and saved value is wiped.
5. Care & Troubleshooting
MarketScreens is built to take care of itself: it reconnects, re-pairs, and restarts on its own. This chapter covers troubleshooting from the gentlest fix to a full reset.
Screens restarting at random, or not all turning on
Check the power brick and cable first: the brick must be the one provided with MarketScreens or another "fast charging" brick, connected with a USB-C-to-USB-C cable — not USB-C-to-USB-A. A standard phone brick can't supply three screens, and underpowering looks like random restarts or dark screens. The brick's USB-A port is only for charging your other devices.
First, the golden fix
Unplug it, wait five seconds, plug it back in. All three screens boot and reload their data. A power cycle clears the large majority of odd states, and it never loses your settings or lists.
WiFi
- "Auto Connecting to WiFi… (try 2/4)" — the DataScreen makes four connection attempts, about 30 seconds each. Let it work; most stubborn mornings connect by the third or fourth try.
- It gave up and shows the network list — your saved network failed four times. Nothing is lost yet: a reboot retries the saved network. Or pick the network and re-enter the password to reconnect on the spot. (Only after five failed boots in a row does MarketScreens forget the saved network.)
- Moved, or new router? Settings → Maintenance → Clear WiFi & Reboot, then set up WiFi as in Chapter 1.
- Mesh systems (eero, Orbi, Nest WiFi, extenders): MarketScreens picks the strongest node at boot and pins to it. After a reboot, a mesh can take a few minutes to relearn where the device lives — if the settings page is briefly unreachable while the screens work fine, give it five minutes before doing anything.
The settings page won't load
- Make sure your phone or computer is on the same WiFi network as MarketScreens — and not on cellular data or a VPN.
- Use the numeric IP address from the gear page (tap
the gear on the DataScreen). The
marketscreens-XXXX.localname is a convenience that some computers and networks resolve slowly or not at all; the IP always works. - Bookmark the IP. If you want it permanent, reserve the DataScreen's address in your router's app (DHCP reservation) so it never changes.
A side screen is stuck
- SCANNING or LOST for more than a minute — the side screen can't hear the DataScreen. Settings → Maintenance → Pair Orange or Pair Blue re-introduces it. If that doesn't work, power cycle.
- NO TICKERS — not stuck: that screen's list is empty. Add tickers to it on the settings page and it wakes on its own.
- Both side screens searching after a reset — normal for a few seconds while they re-pair.
The clock is wrong
- The timezone is detected from your network's location. If your network runs through a VPN, the detected zone follows the VPN — set the time by hand (Settings → Time → Override auto-detected time).
- Your network can also simply be wrong about where it is — some routers are configured to another timezone even without a VPN in sight. Same fix: set the time by hand.
- If the time is off by a few minutes, just Save & Reboot — the clock re-syncs to automatic, exact time.
Updates
Settings → Maintenance → Updates Page. Update All to Newest updates all three screens at once. Leave MarketScreens powered on through the whole process. Each screen verifies its download before installing. A screen that catches a bad update rolls itself back to the last good version automatically.
The escalating resets
In order of severity — try the smallest one that fits:
- Power cycle — clears transient oddities. Loses nothing.
- Reset Screen Connections — the side screens forget their colors and re-pair fresh. Use when Orange and Blue seem confused about who's who. Loses nothing else.
- Clear WiFi & Reboot — forgets the network only. Lists and settings survive.
- Clear All Preferences & Reboot — the factory reset. Everything returns to defaults: lists, saved lists on the device, WiFi, every setting. Use it when handing MarketScreens to someone else, or as the last resort.
When something looks truly wrong
If a screen misbehaves in a way this chapter doesn't cover, press Send State to Proxy on the settings page — it uploads a diagnostic snapshot that makes the problem visible to support — then power cycle. MarketScreens also reports its own health while it runs, so support will have visibility into an issue.
6. Ticker Reference
MarketScreens accepts any symbol Yahoo Finance knows — that's the master catalog, even though stock and ETF prices ride a faster real-time feed during market hours. Type it into a list and watch the surrounding glow: green means recognized, red means not found. If you are trying to find small-value cryptocurrency assets, there's a chance you'll need a specific suffix. The only syntax to learn is a handful of suffixes and prefixes:
| Asset type | Format | Examples |
|---|---|---|
| Stocks | symbol as-is | AAPL, TSLA, FCX |
| ETFs | symbol as-is | SPY, QQQ, COPX |
| Market indices | ^ prefix |
^IXIC, ^GSPC, ^DJI,
^RUT |
| Cryptocurrency | -USD suffix |
BTC-USD, ETH-USD,
SOL-USD |
| Futures & commodities | =F suffix |
GC=F (gold), CL=F (oil), HG=F
(copper) |
| Foreign exchange | pair + =X |
EURUSD=X, USDJPY=X |
| Mutual funds | symbol as-is | VFIAX, FXAIX |
| Treasury yields | ^ prefix |
^TNX (10-year), ^TYX (30-year) |
Each screen's list holds up to 15 tickers.
Good to know
- Indices show point values, not dollars — no
$sign on those. - Crypto trades around the clock — its charts cover the last 24 hours, weekends included, and its price/percent ignores the market-hours indicator.
- Mutual funds price once a day at market close, so their chart is a flat line at the latest closing price.
- Futures and forex keep long sessions — nearly around the clock on weekdays — so their charts can look different from stock charts, and thin on weekends.
- Freshness: prices refresh every couple of minutes. During market hours, stocks and ETFs come from a real-time feed; other asset types can lag several minutes behind the tape. The chart's time axis always shows the timestamp of the data, not the clock.
- Weekends and holidays show the most recent trading session; the date on the time axis tells you which day you're looking at.
- The price flash: on the DataScreen, a price briefly flashes green or red when it changes during a refresh — up or down since its last value.
Market Indicator Symbols
The symbol in each side screen's corner tracks the US stock market's official calendar (all times Eastern):
| Symbol | Color | State | When |
|---|---|---|---|
| ● | Green | Open | 9:30 AM – 4:00 PM, weekdays |
| ◐ | Pink | Pre-market | 4:00 AM – 9:30 AM, weekdays |
| ◑ | Purple | Post-market | 4:00 PM – 8:00 PM, weekdays |
| ○ | Grey | Closed | Overnight and weekends |
| ✕ | Red | Holiday | Market holidays and early-close afternoons |
Holidays and early closes follow the official NYSE calendar automatically — nothing to configure.
Terminology
| Term | Meaning |
|---|---|
| 24h Δ | Percent change since the previous market close |
| 50d Δ | Percent distance from the moving average you chose — 50d means a 50-day average |
| VOL | Volume traded so far today |
| 52w POS | Where the price sits in its high–low range over your lookback window, from 0 (at the low) to 100 (at the high) — 52w means a 52-week window |
| HV20 | Historical volatility: how much the price has moved over the last 20 trading days, scaled to a yearly figure |
| 200d | Whether the price is above (▲) or below (▼) its 200-day moving average |
| MACD | Momentum (Moving Average Convergence/Divergence): ▲ when momentum is building, ▼ when it's fading |
| VWAP | Volume-weighted average price — the session's average price, weighted by how much traded at each level |
| RSI | Relative strength index, 0–100: low readings mean oversold, high readings mean overbought |
| CMF | Chaikin Money Flow, −1 to +1: positive means volume is arriving on up days, negative means it's leaving on down days |
| BB | Bollinger %B: where the price sits between its Bollinger Bands — 0% at the lower band, 100% at the upper, beyond either is statistically extreme |
| OBV | On-balance volume vs. its average: ▲ above, ▼ below |
Printable Manual (PDF)
The same manual as a 29-page printable booklet — the one that ships in the box.